
AI inference efficiency now decides how much useful product work a model can do within a latency and power budget. That changes the buying question. Peak FLOPS and a single tokens-per-second figure are not enough. A team needs to know time to first token, token cadence, memory pressure, batch behavior, and watts at the service level.
Why AI Inference Efficiency Is Now the Competitive Edge
Inference is the recurring part of AI economics. Training may make headlines, but every chat response, retrieval pass, image request, tool call, and agent step consumes serving capacity. A model that costs less to serve can support longer context windows, more retries, richer tool use, or a lower price without changing the user experience.
The pressure is clearest in agentic workloads. A simple chat completion may need one request. An agent can trigger a planner, retrieve documents, call tools, inspect results, and generate a final response. Each turn adds prefill work and decode work. A slow response early in the chain delays everything behind it.
OpenAI reported that its Jalapeno custom inference system delivered 1.5x to 1.9x more AI work per watt at peak throughput, 1.7x to 3.6x lower end-to-end latency, and 2.1x to 4.1x higher performance for interactive workloads across three public models. The company also reports a 700 W chip rating with sustained power at or below 550 W in the tested workloads. Those are vendor measurements, not a universal procurement result, but they show where competition has moved: useful output under a real operating constraint.
Measure the request, not just the accelerator
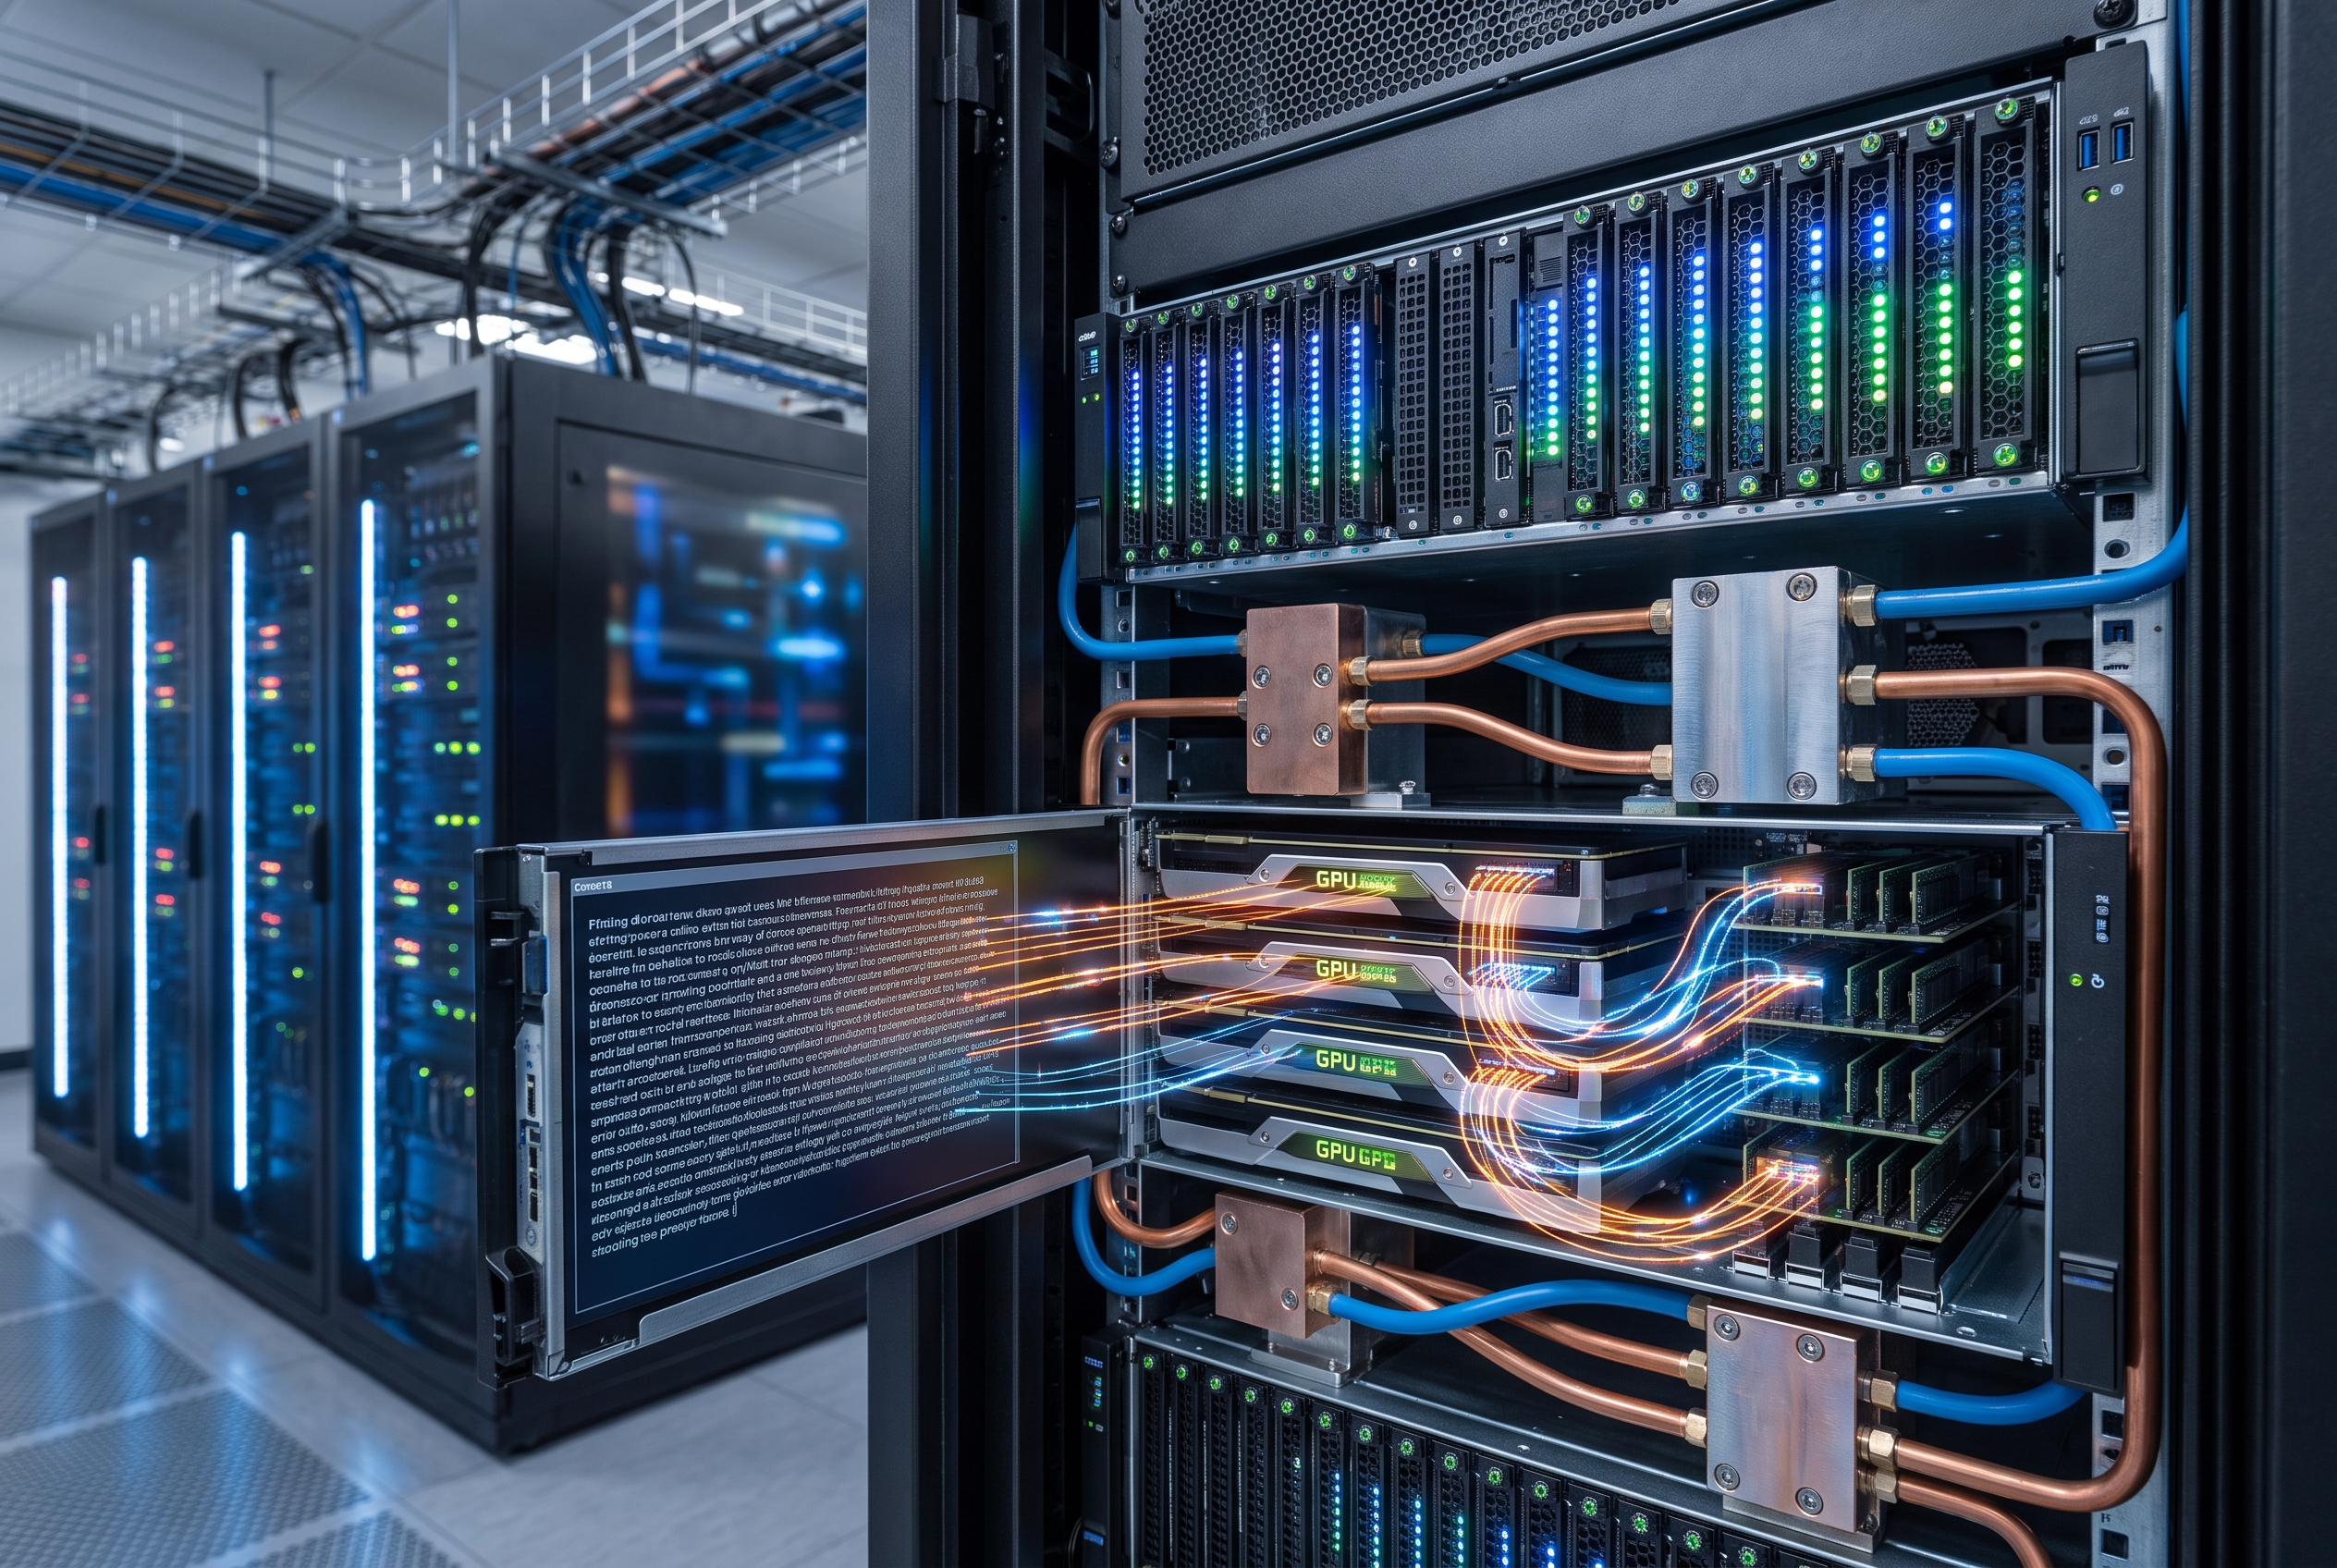
Language-model serving has two different bottlenecks. Prefill processes the prompt and builds the KV cache. It tends to be compute-heavy. Decode generates one token at a time and often becomes memory-bandwidth-bound. Long context raises prefill cost. Long answers raise decode cost. A deployment tuned for one can disappoint on the other.
Track time to first token for responsiveness. Track time per output token or tokens per second for the reading experience. Then add end-to-end latency, requests per second at a stated service-level objective, and energy per request or tokens per kilowatt-hour. The unit matters. A fast batch benchmark can look excellent while an interactive user waits too long.
MLPerf Inference v5.0 made this distinction explicit. Its Llama 3.1 405B server scenario sets 6 seconds for time to first token and 175 ms for time per output token. Its Llama 2 70B Interactive scenario tightens those targets to 450 ms and 40 ms respectively, or 25 tokens per second per user. That is a useful reminder that throughput without a latency target is incomplete.
Queueing changes the picture again. When utilization approaches saturation, tail latency can climb sharply. A service that appears cheap at average load can miss its p95 target during a traffic spike. Capacity plans need concurrency, prompt-length distribution, output-length distribution, cache hit rate, and the target percentile. Do not size a production cluster from a median prompt alone.
The full-stack levers behind better results
Precision is one lever. Lower-precision formats can improve throughput and reduce memory traffic, provided quality stays within the workload tolerance. NVIDIA says its Blackwell FP4 path can provide twice the peak throughput of FP8 while meeting MLPerf accuracy requirements in the reported submissions. The detail that matters is the validation set. A coding assistant, support bot, and vision model will not have the same tolerance for quantization error.
Batching is another lever, but it has a cost. Larger batches usually raise hardware utilization and throughput. They can also delay a short interactive request behind a large prefill. Continuous batching, request prioritization, and separate pools for interactive and offline traffic help manage that trade-off.
Memory placement is often the hidden constraint. The KV cache grows with sequence length, layer count, hidden size, and active requests. If cache pages move between devices or spill to slower memory, token cadence drops. Prefix caching can avoid repeated prefill work for shared system prompts and common document prefixes. It should be measured with realistic cache hit rates, not assumed.
Networking matters when a model spans chips. NVIDIA reported that a GB200 NVL72, with 72 GPUs connected through NVLink and NVSwitch, reached up to 3.4x higher per-GPU Llama 3.1 405B performance than an eight-GPU H200 system in its MLPerf v5.0 comparison. The claimed 30x system-level gain combines per-GPU performance with a much larger connected domain. That distinction matters: rack-scale results do not translate directly to a small cluster.
Practical takeaways for developers and infrastructure teams
Start with a traffic trace
Build a representative test set from production-safe request shapes. Include short chat, long retrieval-augmented prompts, tool-using agent turns, and long outputs. Record prompt tokens, output tokens, concurrency, and service-level targets. This prevents a benchmark from optimizing the wrong workload.
Separate interactive and batch paths
Interactive traffic needs predictable time to first token. Offline summarization, indexing, and evaluation jobs can tolerate deeper queues. Separate scheduling policies or pools reduce contention. This often produces a better result than forcing one batch size onto every job.
Profile prefill and decode independently
Measure GPU compute use, memory bandwidth, KV-cache allocation, network transfer, and queue time by phase. If decode is memory-bound, adding compute may not fix it. If prefill dominates, prompt reduction, cache reuse, and better batching can matter more than a faster decoder.
Set a quality gate before quantizing
Run the actual task suite before moving from FP8 to FP4 or another compressed path. Check exact-match tasks, structured-output validity, retrieval faithfulness, and human review where it is needed. An efficiency gain that raises retry rates can erase its own benefit.
Report a cost that maps to a product decision
Report cost and energy per completed task at a stated p95 latency target. Include failed responses and retries. That makes it possible to compare a smaller model with better routing against a larger model that handles every request. A router can send routine work to a smaller model and reserve heavier capacity for requests that prove harder.
Benchmarks need context before they become architecture
MLPerf is useful because it defines workloads, accuracy rules, and scenarios across datacenter and edge systems. It is not a substitute for a deployment test. Vendor submissions use carefully tuned software, defined model versions, and specific system configurations. Read the scenario, latency target, precision, number of accelerators, and power methodology before comparing a headline number.
The same caution applies to first-party announcements. OpenAI measures Jalapeno using the public InferenceX benchmark and emphasizes matched user experience, throughput, power, and latency. That framing is sensible, but every team should reproduce the decision on its own workload. The winning system is the one that meets a product target with headroom, not the one with the largest isolated score.
For teams choosing a model layer as well as a serving stack, test the experience end to end. Compare prompt fit, output quality, tool reliability, and response behavior alongside serving metrics. The model posts on distributed AI inference and low-latency AI hardware provide related context on why cluster topology and latency targets change the answer.
AI inference efficiency is no longer an infrastructure afterthought. It is product design, capacity planning, and model selection meeting in one operational metric. Run the models that fit the workload, inspect their outputs, and test the serving assumptions yourself on Wiro.
Sources: OpenAI Jalapeno first results; MLCommons MLPerf Inference v5.0; NVIDIA MLPerf Inference v5.0 analysis.