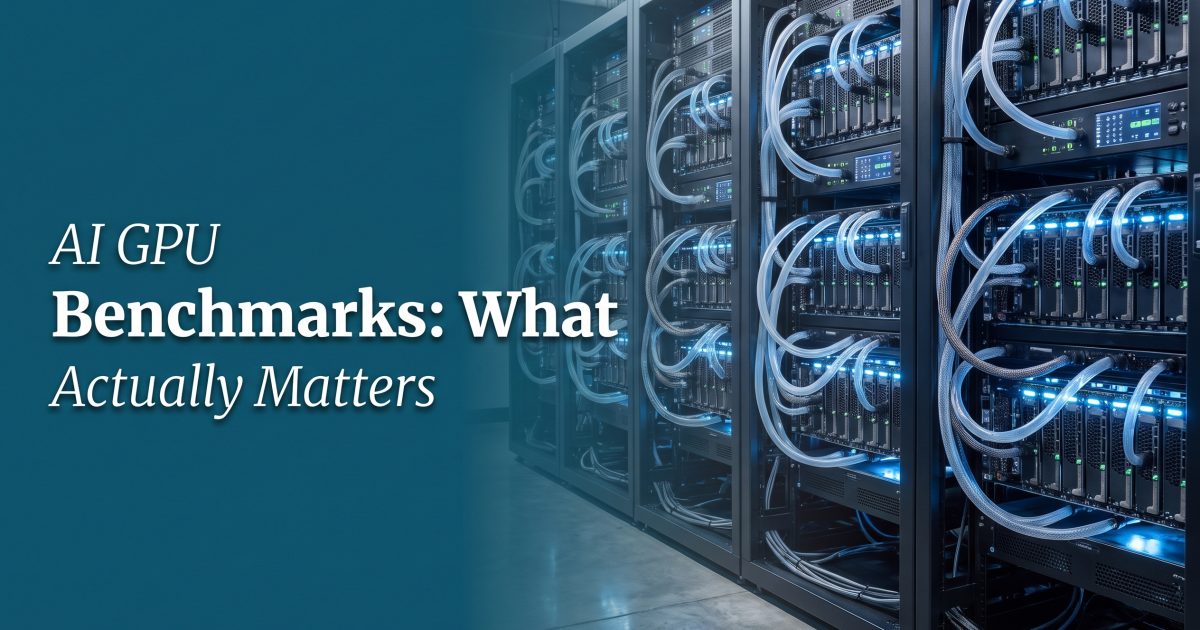
AI GPU benchmarks only help when they resemble the job a team plans to run. A chart that puts one accelerator ahead on tokens per second can hide the details that drive an actual deployment: model size, context length, batch size, precision, latency target, host-to-device traffic, and the cost of retries. For generative AI, the useful result is not a universal winner. It is a measured answer to a narrower question: how much useful work can this stack finish inside its latency, capacity, and reliability limits?
Contents
AI GPU benchmarks need workload context
Training and inference benchmarks answer different questions. MLPerf Training measures time to reach a defined quality target. That makes it useful for comparing an end-to-end training recipe, not merely raw matrix throughput. MLPerf Inference measures how quickly a trained model processes inputs and returns results under defined scenarios. Neither should be read as a promise for a different model, framework, or service-level objective.
The scale behind a result matters too. NVIDIA reported a 10-minute Llama 3.1 405B pretraining result on 5,120 Blackwell GPUs in MLPerf Training v5.1, with 85% scaling efficiency from 512 to 5,120 GPUs. The same report lists 12.5 minutes for FLUX.1 training on 1,152 Blackwell GPUs. Those are useful reference points because they disclose both elapsed time and system count. They do not mean a single GPU will train either workload in minutes. Read the submission context and table before turning a headline into a purchasing assumption.
The numbers that translate to production
Throughput is still important. For batch embeddings, offline rendering, or a queue of image jobs, completed requests per second can drive cluster size. But an interactive copilot, image editor, or agent has a different failure mode: a user waits for the first visible response. Track time to first token for language models, then inter-token latency or tokens per second after generation begins. A healthy average can still hide a slow p95 or p99 that makes the product feel stuck.
Use at least five metrics in every run:
- End-to-end latency: from request arrival to usable output, including tokenization, queueing, retrieval, safety checks, encoding, and transfer.
- Tail latency: p95 and p99, not only the mean. This reveals contention and memory pressure.
- Throughput at the target SLA: requests, images, frames, or generated tokens per second while latency stays inside the product limit.
- Peak accelerator memory: model weights are only the starting point. KV cache, activations, image latents, and batching often set the real limit.
- Failure and retry rate: out-of-memory errors, compilation misses, timeouts, and failed generations turn advertised capacity into waste.
For LLM serving, context length changes the result dramatically. A test with short prompts can look excellent yet fail once users attach long documents and the KV cache grows. For image generation, resolution, sampler, step count, ControlNet-like conditioning, and upscaling all shift memory use and elapsed time. Video expands the pressure again because frame count, temporal attention, and encoding add work. Keep those settings fixed before comparing hardware.
Build a benchmark that matches the traffic
Start with a small, versioned workload pack. Include representative prompts, input lengths, output targets, seeds where the model supports them, and a mix of easy and hard requests. A team serving a code assistant might test 1,000-token, 8,000-token, and 32,000-token contexts. A creative service might test 1024-pixel images, a higher-resolution edit, and a short video clip. Record model revision, container image, driver, CUDA or ROCm version, framework, quantization, and engine settings. A benchmark without these details cannot be reproduced after the next update.
Run cold and warm measurements separately. Cold starts expose model loading, graph compilation, and cache creation. Warm runs show steady-state capacity. Then add concurrent traffic in steps: 1, 2, 4, 8, and so on. Stop increasing concurrency when p95 latency breaks the service objective, peak memory leaves too little headroom, or error rates rise. That knee in the curve is often more useful than the highest throughput number.
| Test field | Record it | Why it changes the decision |
|---|---|---|
| Model, revision, and precision | Exact model hash and FP8, FP16, BF16, or quantized format | Accuracy, memory use, and speed move together. |
| Input and output shape | Context length, generated tokens, resolution, frames, and steps | It defines the actual amount of work. |
| Load profile | Concurrency, arrival pattern, and batch policy | It exposes queueing and tail latency. |
| System topology | GPU count, interconnect, CPU, RAM, storage, and network | Multi-GPU jobs can bottleneck outside the accelerator. |
| Quality guardrail | Task score, accepted output rate, or human pass rate | A faster setting is worthless if it creates extra work. |
What developers and infrastructure teams should decide
Developers should benchmark the model path, not a synthetic substitute. Test the tokenizer, retrieval layer, tool calls, output parser, and post-processing that the application uses. Include one malformed or oversized request to confirm how the service fails. If an application needs streaming, capture time to first token and the cadence of later tokens. If it needs images, measure the full path through moderation, storage, and delivery rather than only denoising time.
Infrastructure teams should use the results to set admission control and capacity buffers. A configuration that peaks at 95% memory can look efficient in a lab, then fall over when several long-context requests arrive together. Leave headroom for fragmentation, model updates, and the occasional larger request. Compare nodes at the same quality setting and SLA. A faster GPU can lose its advantage if the host cannot feed it, the network throttles distributed inference, or a queue spends most of its time waiting.
Power and cooling belong in the scorecard as well. At rack scale, watts per completed request and thermal limits influence density, operating cost, and how many accelerators can run at full speed. Measure power over the same steady-state window as throughput. Pair that number with utilization and completion rate; low watts do not help if the service needs twice as many servers.
Practical AI GPU benchmarks checklist
Publish the workload, hardware count, software versions, precision, concurrency, latency percentiles, peak memory, and failure rate. Separate cold from warm runs. Repeat tests after driver, engine, or model upgrades. Compare cost per accepted result or cost per million useful tokens internally, but do not let cost erase the quality and latency limits users actually notice.
The best AI GPU benchmarks make a deployment decision easier. They show what was tested, where the system bends under load, and which setting still delivers usable output. Run current generative models on Wiro, keep the prompt and output target constant across candidates, and measure the complete workflow before committing production capacity.